


 107 / 111

106
L&R Sozialforschung
Wiedereinstiegsmonitoring
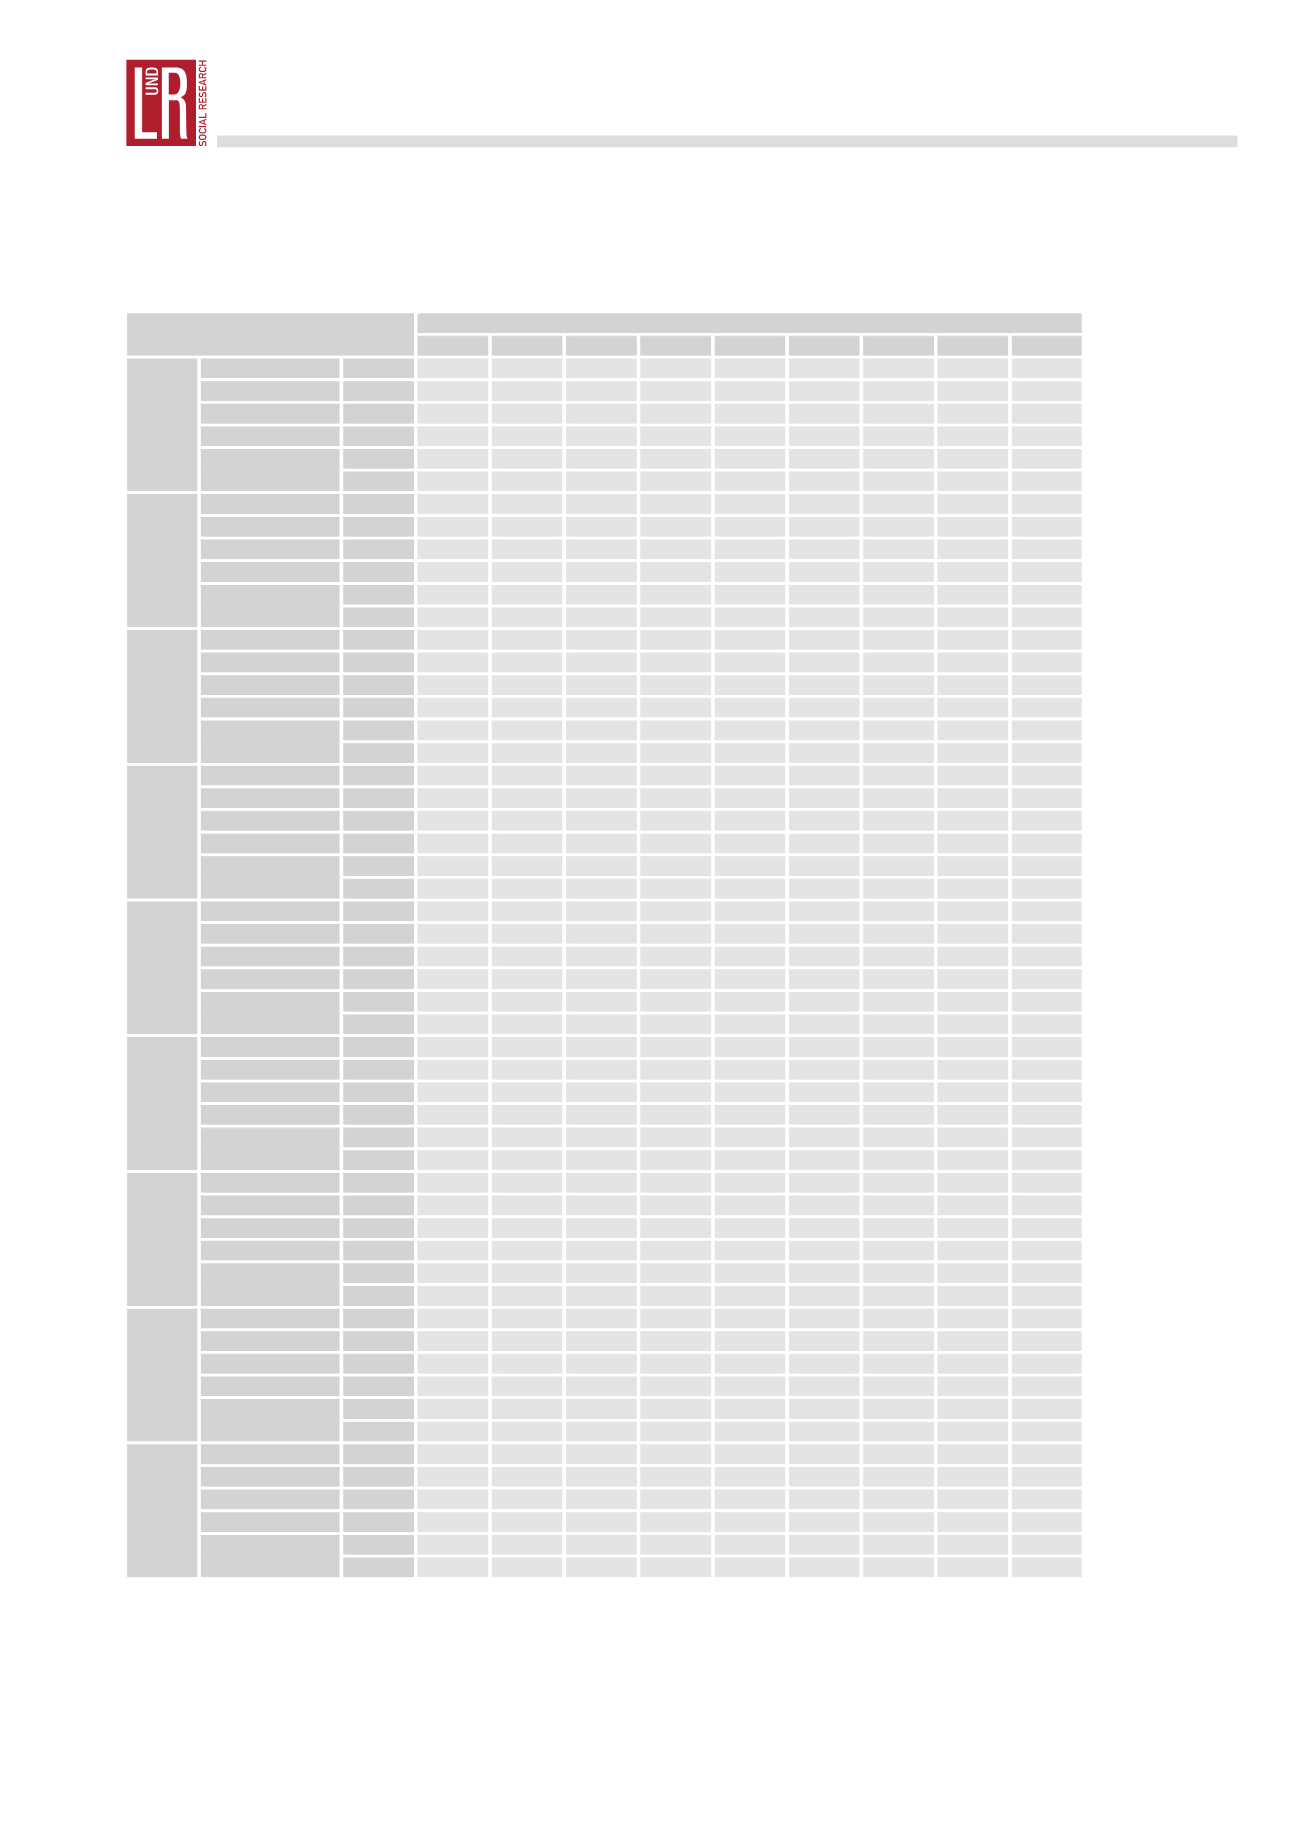
Tabelle 19: Beschäftigungsentwicklung im Vor- und Nachbeobachtungszeitraum nach Ge-
schlecht, Beobachtungsjahr, Kohorte und Vorkarriere (Personen ohne erneuter
Kinderauszeit); Geschlecht: Männlich; Status Vorkarriere: Überwiegend Beschäftig-
te
Beobachtungsjahr
Zuvor
1. Jahr
2. Jahr
3. Jahr
4. Jahr
5. Jahr
6. Jahr
7. Jahr
8. Jahr
2006
Nullniveau
Anteil
0,0%
22,4%
20,4%
14,3%
12,6%
11,7%
13,1%
9,3%
9,6%
Niedriges Niveau
Anteil
0,0%
15,8%
5,8%
6,5%
6,0%
3,3%
5,2%
6,9%
1,8%
Mittleres Niveau
Anteil
10,1%
18,0%
10,2%
7,4%
6,5%
7,0%
6,1%
7,4%
11,0%
Hohes Niveau
Anteil
89,9%
43,9%
63,7%
71,9%
74,9%
78,0%
75,6%
76,4%
77,5%
Gesamt
Anteil
100%
100%
100%
100%
100%
100%
100%
100%
100%
Fälle
218
228
226
217
215
214
213
216
218
2007
Nullniveau
Anteil
0,0%
12,8%
11,1%
7,5%
8,5%
11,8%
9,8%
10,4%
10,0%
Niedriges Niveau
Anteil
0,0%
16,9%
9,2%
4,2%
4,2%
5,7%
3,3%
4,2%
4,3%
Mittleres Niveau
Anteil
11,8%
13,7%
10,1%
10,8%
10,8%
4,7%
9,3%
9,0%
7,6%
Hohes Niveau
Anteil
88,2%
56,6%
69,6%
77,4%
76,4%
77,8%
77,6%
76,4%
78,2%
Gesamt
Anteil
100%
100%
100%
100%
100%
100%
100%
100%
100%
Fälle
211
219
217
212
212
212
214
212
211
2008
Nullniveau
Anteil
0,0%
15,0%
11,2%
9,5%
8,5%
10,4%
11,4%
12,1%
Niedriges Niveau
Anteil
0,0%
15,0%
7,7%
6,0%
7,8%
5,4%
4,3%
4,6%
Mittleres Niveau
Anteil
10,0%
18,2%
9,4%
7,7%
9,9%
5,4%
7,9%
6,1%
Hohes Niveau
Anteil
90,0%
51,7%
71,7%
76,8%
73,9%
78,9%
76,4%
77,1%
Gesamt
Anteil
100%
100%
100%
100%
100%
100%
100%
100%
Fälle
280
286
286
285
283
280
280
280
2009
Nullniveau
Anteil
0,0%
13,6%
8,4%
5,9%
5,7%
8,6%
10,1%
Niedriges Niveau
Anteil
0,0%
11,7%
5,7%
4,6%
5,9%
4,9%
5,9%
Mittleres Niveau
Anteil
7,9%
19,5%
11,7%
9,0%
8,9%
7,9%
6,9%
Hohes Niveau
Anteil
92,1%
55,2%
74,2%
80,4%
79,5%
78,6%
77,1%
Gesamt
Anteil
100%
100%
100%
100%
100%
100%
100%
Fälle
407
420
418
409
405
407
407
2010
Nullniveau
Anteil
0,0%
11,5%
6,4%
5,6%
9,2%
6,8%
Niedriges Niveau
Anteil
0,0%
10,3%
5,9%
6,3%
4,3%
4,5%
Mittleres Niveau
Anteil
8,8%
14,5%
10,8%
8,6%
6,4%
6,6%
Hohes Niveau
Anteil
91,2%
63,7%
76,8%
79,5%
80,2%
82,1%
Gesamt
Anteil
100%
100%
100%
100%
100%
100%
Fälle
396
408
406
396
393
396
2011
Nullniveau
Anteil
0,0%
7,8%
5,0%
5,8%
6,9%
Niedriges Niveau
Anteil
0,0%
10,4%
5,2%
3,7%
4,0%
Mittleres Niveau
Anteil
7,1%
14,5%
7,7%
7,1%
8,5%
Hohes Niveau
Anteil
92,9%
67,3%
82,2%
83,4%
80,6%
Gesamt
Anteil
100%
100%
100%
100%
100%
Fälle
480
489
483
481
480
2012
Nullniveau
Anteil
0,0%
8,6%
7,3%
6,5%
Niedriges Niveau
Anteil
0,0%
8,9%
4,7%
3,1%
Mittleres Niveau
Anteil
6,7%
17,5%
7,8%
9,1%
Hohes Niveau
Anteil
93,3%
64,9%
80,2%
81,4%
Gesamt
Anteil
100%
100%
100%
100%
Fälle
585
593
591
585
2013
Nullniveau
Anteil
0,0%
10,3%
5,9%
Niedriges Niveau
Anteil
0,0%
6,6%
6,3%
Mittleres Niveau
Anteil
5,8%
15,0%
8,2%
Hohes Niveau
Anteil
94,2%
68,1%
79,6%
Gesamt
Anteil
100%
100%
100%
Fälle
573
574
573
2014
Nullniveau
Anteil
0,0%
7,6%
Niedriges Niveau
Anteil
0,0%
9,0%
Mittleres Niveau
Anteil
6,1%
13,2%
Hohes Niveau
Anteil
93,9%
70,2%
Gesamt
Anteil
100%
100%
Fälle
644
644
Quelle: L&R Database 'WIMON 2006 bis 2014', 2017